How to monitor your AdGuardHome via netdata
Short description how to integrate AdGuardHome inside your netdata dashboard.

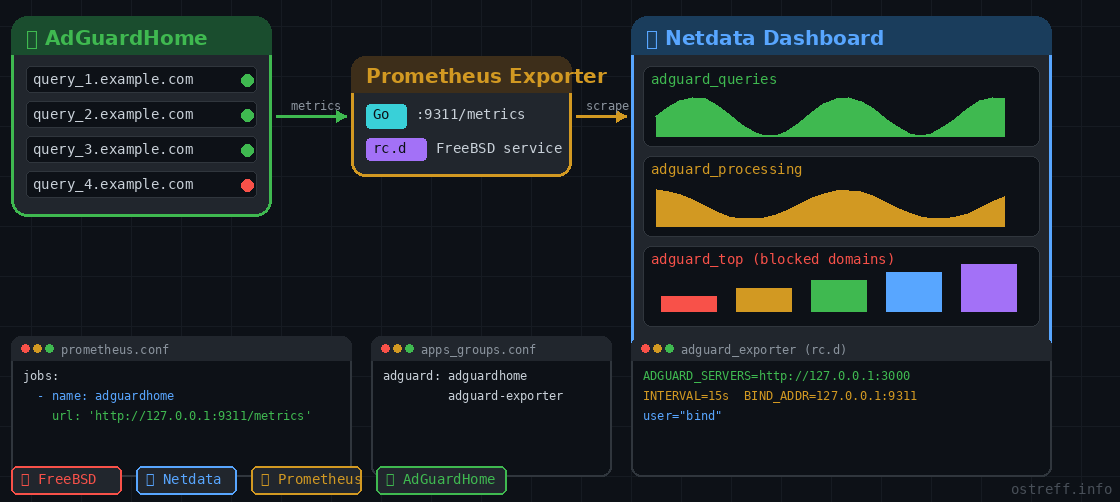
This guide covers compiling the AdGuardHome Prometheus exporter from source, configuring it natively using the FreeBSD rc.subr framework under a non-privileged user (bind or unbound or adguardhome), and feeding the telemetry into Netdata.
1. Build the Exporter from Source
Since the exporter is written in Go, we install the Go compiler, clone the repository, and build a clean binary optimized for your system:
# Install Go and Git
pkg install go git

# Clone and build
cd /usr/local/src
git clone https://github.com/henrywhitaker3/adguard-exporter.git
cd adguard-exporter
go build -o adguard-exporter main.go

# Move to system path
install -m 755 adguard-exporter /usr/local/bin/adguard-exporter
2. Create the FreeBSD rc.d Service Script
To run the exporter safely as a background daemon under the bind user context, create the startup script at /usr/local/etc/rc.d/adguard_exporter:
Find on which ip:port the adguard dashboard interface is working:
grep 'address:' /usr/local/etc/adguardhome/AdGuardHome.yaml
  address: 0.0.0.0:3000
#!/bin/sh
# PROVIDE: adguard_exporter
# REQUIRE: LOGIN adguardhome
# KEYWORD: shutdown
. /etc/rc.subr
name="adguard_exporter"
rcvar="adguard_exporter_enable"
load_rc_config $name
: ${adguard_exporter_enable:="NO"}
: ${adguard_exporter_user:="bind"}
pidfile="/tmp/${name}.pid"
procname="/usr/local/bin/adguard-exporter"
# Natively pass Environment Variables to the 'bind' user context
# Note: The exporter source code expects plural variable names
adguard_exporter_env="ADGUARD_SERVERS=http://127.0.0.1:3000 \
ADGUARD_USERNAMES=your_username \
ADGUARD_PASSWORDS=your_password \
INTERVAL=15s \
BIND_ADDR=127.0.0.1:9311"
command="/usr/sbin/daemon"
command_args="-f -p ${pidfile} -o /tmp/${name}.log ${procname}"
run_rc_command "$1"Note: Change http://127.0.0.1:3000 to match your local AdGuard Home web panel port, and replace the placeholder credentials with your actual AGH details. Also change the BIND_ADDR= value with something relevant to your system.
3. Enable and Start the Service
Configure the system to run the service as the bind user, then start it up:
chmod +x /usr/local/etc/rc.d/adguard_exporter
sysrc adguard_exporter_enable="YES"
sysrc adguard_exporter_user="bind"

service adguard_exporter start
Verify that the exporter is successfully listening locally on port 9311:
sockstat -4l | grep 93114. Configure Netdata Integration
Netdata utilizes its native Prometheus collector (go.d.plugin) to scrape metrics from the newly created endpoint. Edit the Netdata configuration file:
cd /usr/local/etc/netdata/
./edit-config go.d/prometheus.conf
Add your custom scrape job to the file:
jobs:
  - name: adguardhome
    url: 'http://127.0.0.1:9311/metrics'
5. Group Processes & Restart
To ensure Netdata cleanly groups the resource usage (CPU/RAM) of the processes under an "adguard" category instead of dropping them into generic buckets, map them in apps_groups.conf:
cd /usr/local/etc/netdata/
./edit-config apps_groups.conf
Add the following line near other DNS software definitions:
adguard: adguardhome adguard-exporterFinally, restart Netdata to apply all configuration changes:
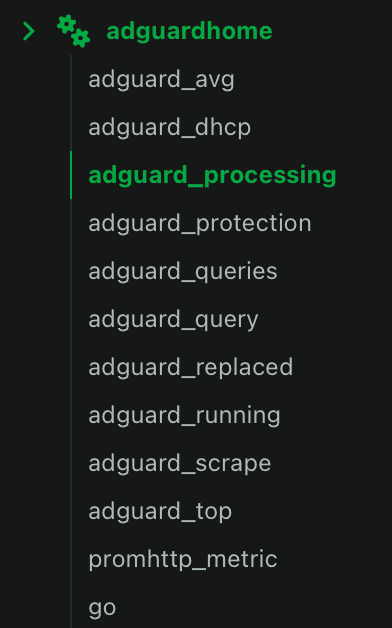
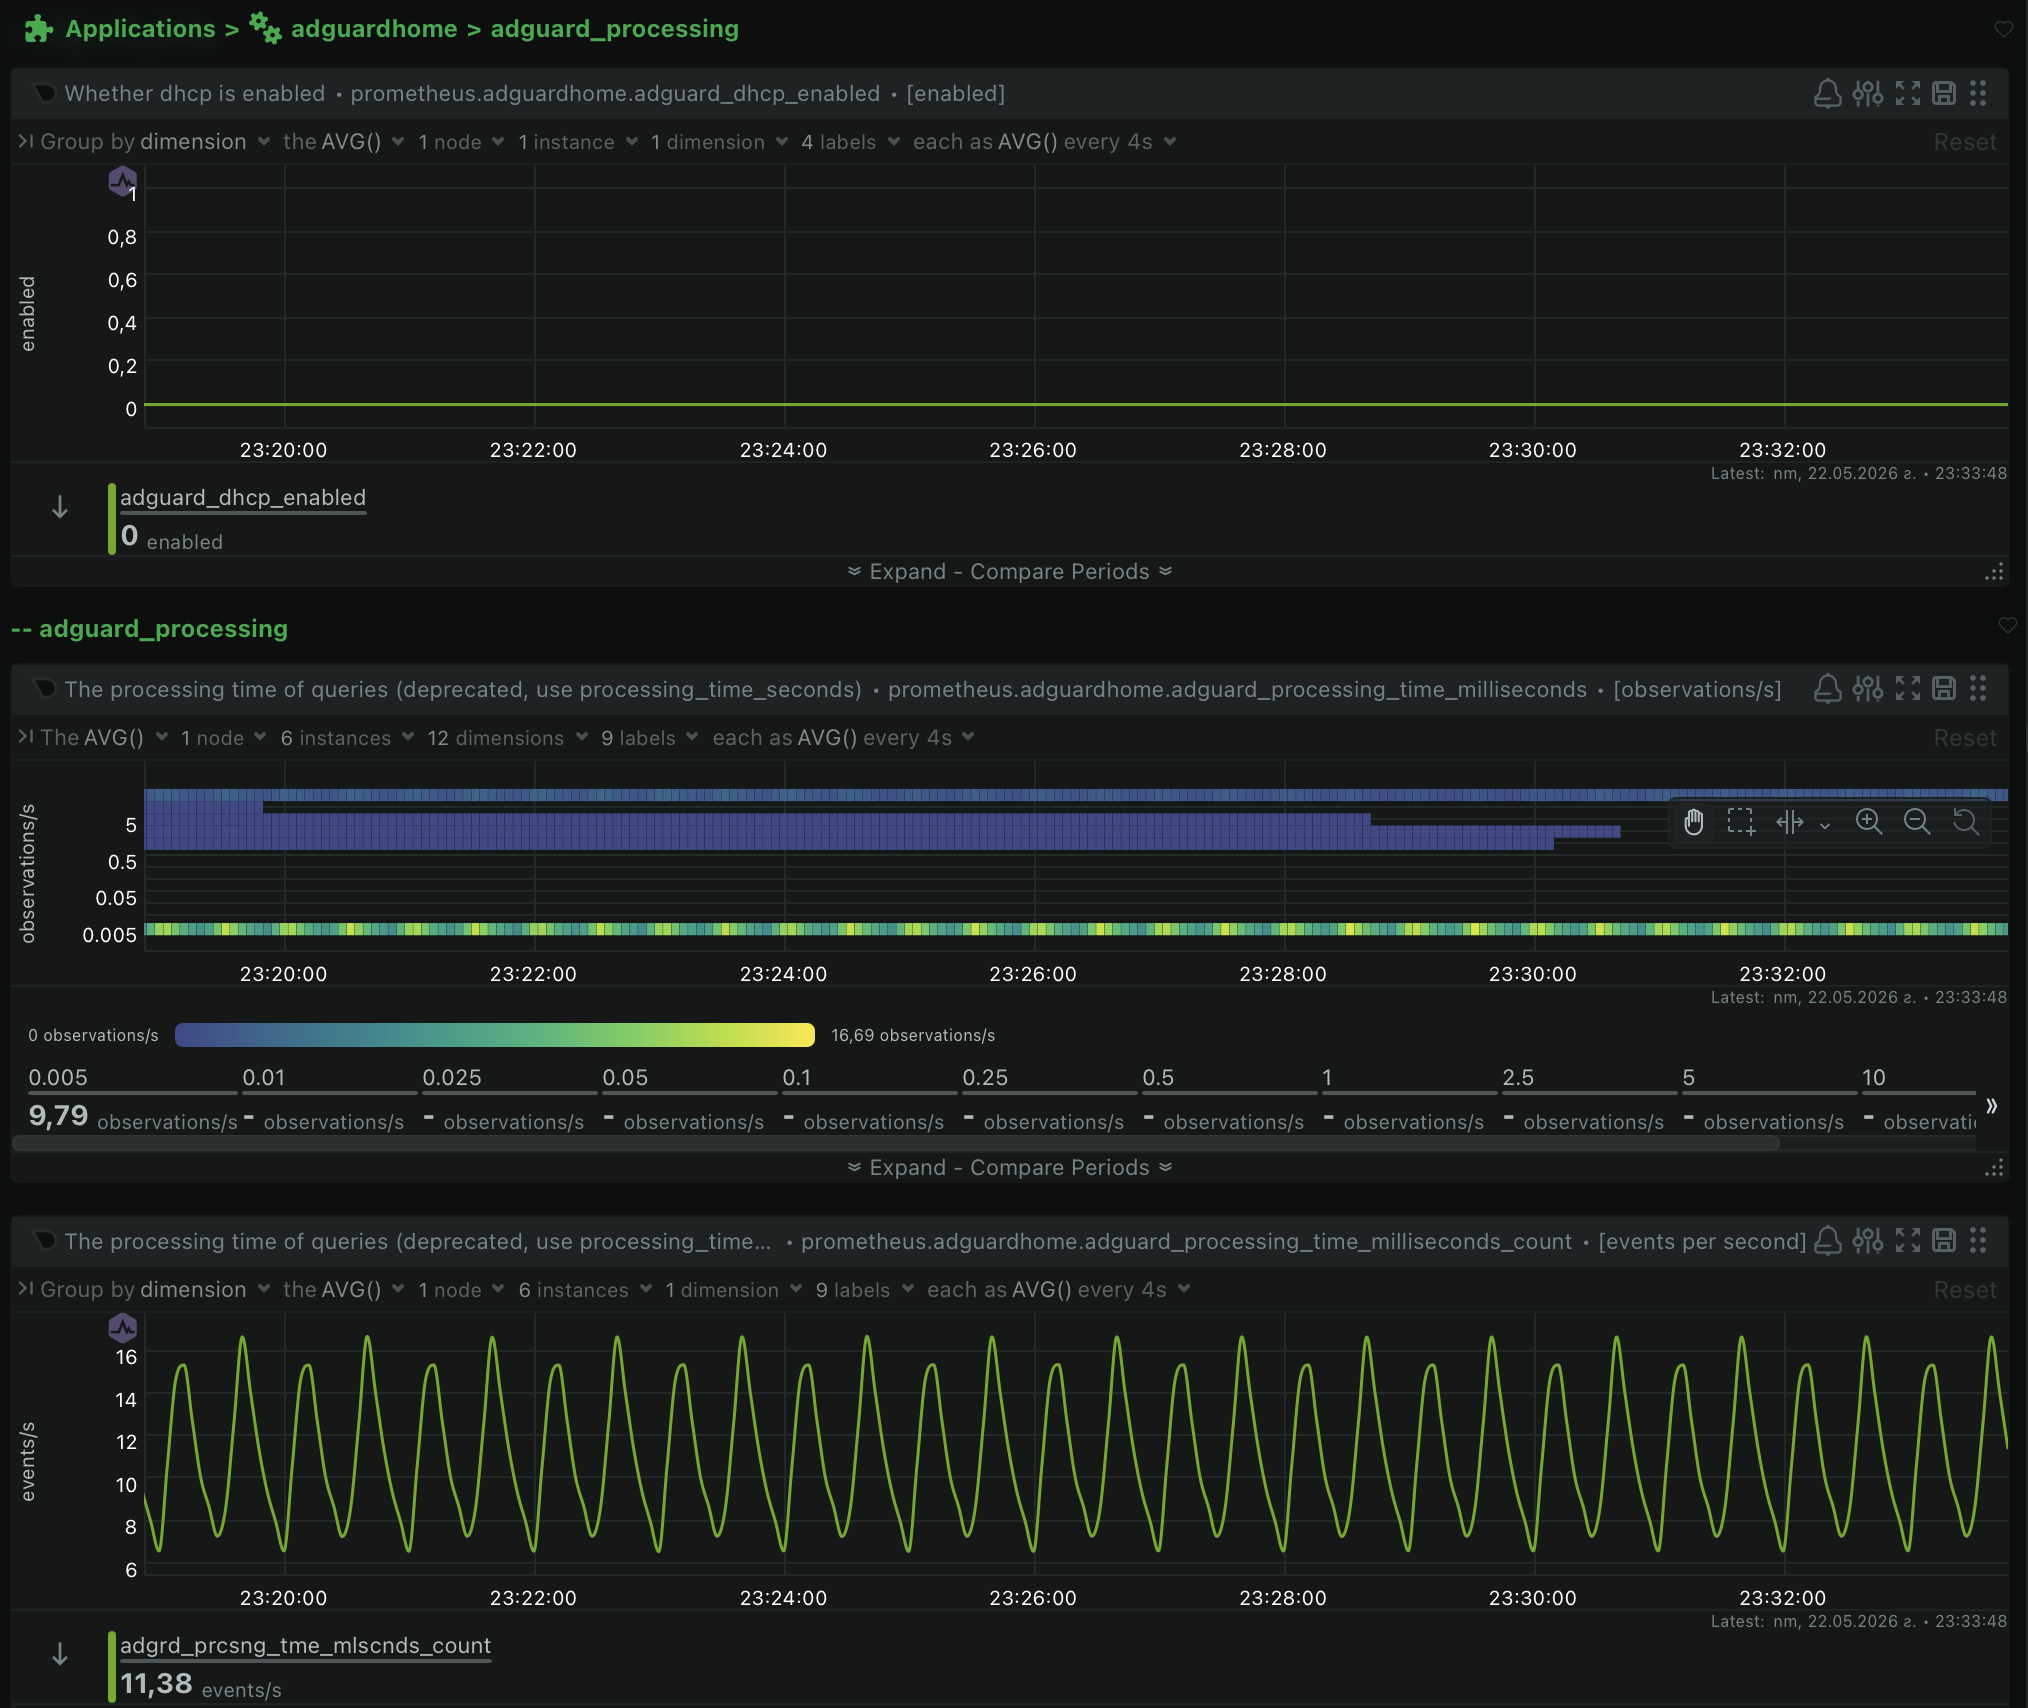
service netdata restartOnce restarted, a dedicated adguardhome section with high-resolution charts for queries, blocks, processing times, and top lists will automatically populate on your Netdata dashboard.